I run most of my products on one Vercel account. Envpilot, PagePilot, Wryte, a handful of smaller sites. All of them together share the Hobby plan: 4 hours of Fluid Active CPU a month, 1 million function invocations, 200,000 ISR writes, 100 GB of data transfer. It’s a generous free tier if your projects behave.
Mine didn’t.
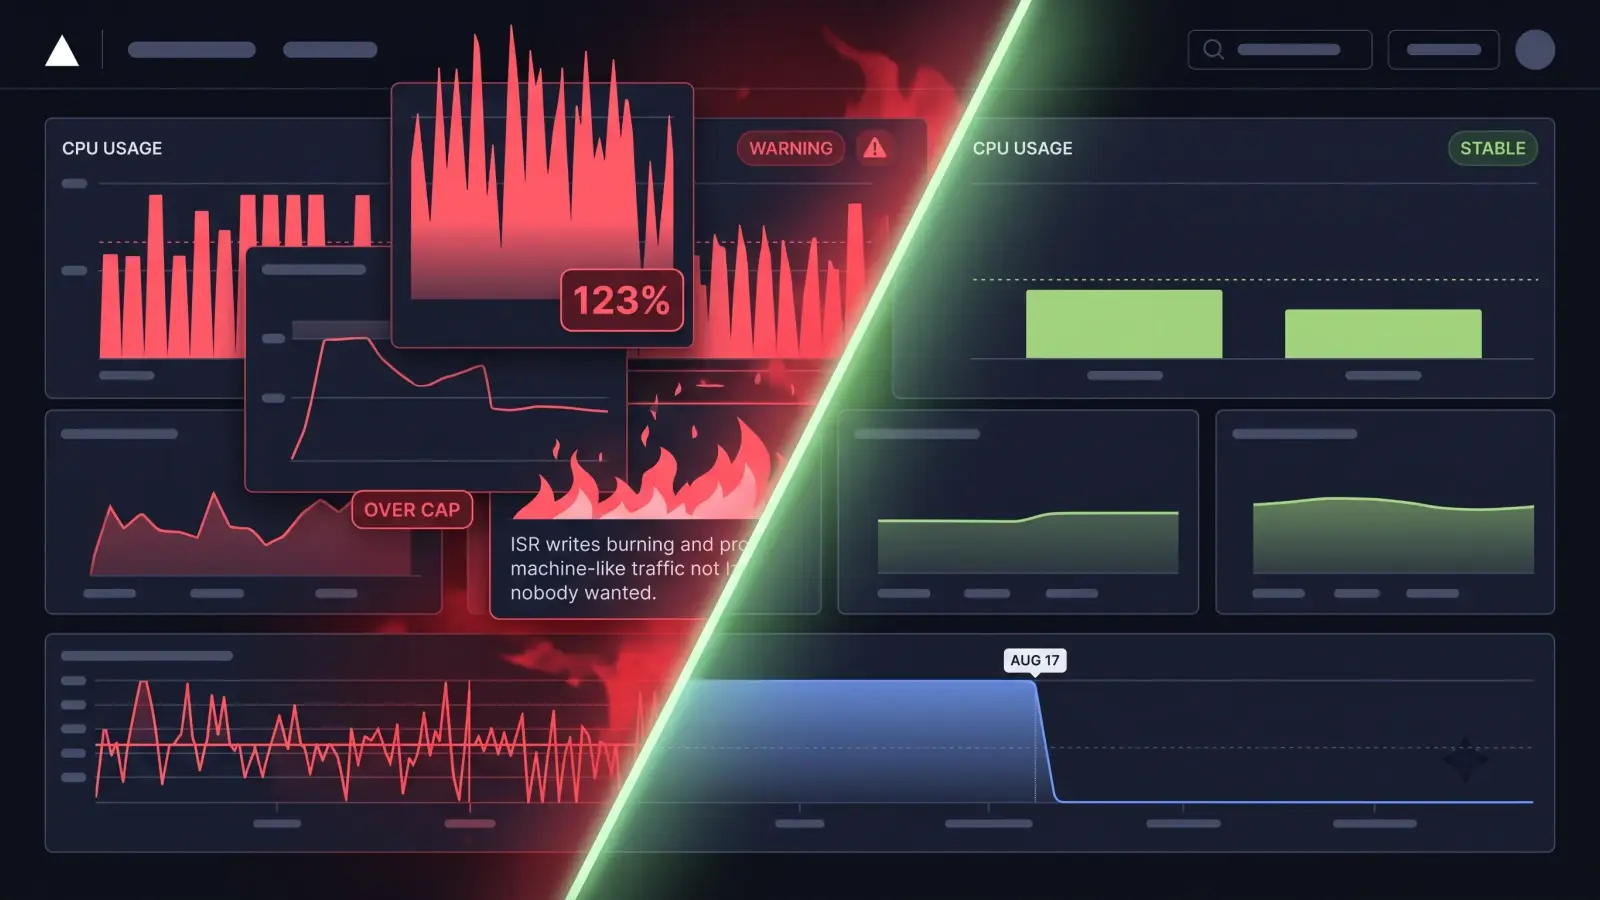
A few weeks ago I opened the usage page and the Fluid Active CPU gauge read 4h 57m against a 4h cap. 123% of the limit, with days left in the billing window. Function invocations at 659,243. ISR writes at 103,783 and climbing on a schedule nobody designed. The two biggest offenders were the two projects I care about most: envpilot.dev and PagePilot.
This is the story of how I read the dashboards, traced every wasted millisecond back to actual lines of code, and fixed it across five PRs. No infrastructure changes, no paid plan, no rewriting the apps. Just deleting work that nobody asked for, and moving data access off a request/response structure that was charging me a toll on every call.
The PR map
Before the deep dive, here’s what actually shipped, because I’ll be naming PRs throughout and I want you to be able to keep score.
| PR | Repo | What it did |
|---|---|---|
| #173 | envpilot.dev | Replaced REST API routes with direct Convex hooks for orgs, projects, tags |
| #182 | envpilot.dev | Moved the whole dashboard off /api/* onto Convex, pooled the vault calls |
| #183 | envpilot.dev | Killed the ISR churn, scoped the middleware, cached /api/version, deleted /api/status |
| #186 | envpilot.dev | Next.js 16.3 Cache Components, static shells, instant dashboard navigation |
| #3 | pagepilot | Scoped Clerk middleware, static landing/docs, edge-cached /p/<id>, aws4fetch |
Two of these are cost PRs, two are rendering PRs, one is an architecture PR. They overlap, because in serverless the architecture is the bill.
Read the dashboard before touching code
The first mistake would have been guessing. The dashboard told a much more specific story.
| Project | Fluid CPU (30d) | Share |
|---|---|---|
| envpilot | 2h 40m | 54.8% |
| pagepilot | 1h 13m | 25.2% |
| wryte-xyz | 30m | 10.3% |
| ourtrail | 19m | 6.6% |
And the ISR writes chart was even more lopsided: envpilot owned 114,200 of 117,295 units. 97.4%. PagePilot wasn’t even on that list.
Two different diseases, then. Envpilot had a write problem. PagePilot had a CPU problem. Both of them turned out to be self-inflicted.
One more detail from the charts before I touched anything: the write rate had been flat at roughly 3,500 units a day since July 19, then stepped up to about 5,500 a day on August 10. Flat around the clock, no weekend dip. That’s not humans. That’s machines. And the CPU step change on PagePilot lined up exactly with one commit, fc2388f, the one that added Clerk. When a cost curve starts the day a specific commit lands, you go read that commit.
Envpilot problem one: the changelog tax
I grepped the whole repo for revalidate. Three routes had time-based revalidation, and one of them explained almost everything.
The changelog page had revalidate = 60. Here’s what that actually meant in practice. Next.js regenerates the entire page from the database every sixty seconds, forever, whether anything changed or not. Each regeneration is a function invocation plus roughly two write units (the HTML and the RSC payload). That’s 1,440 regenerations per day, about 4,000 write units a day, against a changelog that gets updated four times a month. This one route was 71% of the write bill.
The landing page (revalidate = 300) and /api/status (force-static + 300) added another ~576 regens a day on the same pattern. 2,016 total. The math matched the observed baseline to the digit, which is how I knew I’d found the whole disease and not just a symptom.
Why did every window fire instead of the cache quietly expiring unused? Because of the machine traffic. UptimeRobot pinging my status endpoint, crawlers wandering through, Slack link previews. Someone was always touching the page, so every revalidation window found a warm cache and billed a regeneration. The page had visitors I never wanted and never saw.
Around the ISR loop sat machinery that existed only to feed it: an admin changelog editor with its own Convex table and six indexes, a seed migration in CI, and an hourly cron to publish scheduled entries. All of it serving a page that four people read.
The fix, PR #183. The changelog is now one markdown file, apps/web/content/CHANGELOG.md, holding all 79 releases. A twenty-line parser splits it on an <!-- entry --> marker, Zod validates each entry’s frontmatter, and the same MDX pipeline that renders my blog renders the page at build time. Filtering and paging happen on the client. Zero compute per visitor, zero writes per day. The admin editor, the table, the seed step, and the cron are gone.
Two bugs showed up during that migration and both are worth knowing about:
- gray-matter only recognizes frontmatter fences at offset zero. Splitting the file left a leading newline on every block, so all 79 entries failed validation. Loud failure, easy fix.
- Worse:
bun run format:fixran Prettier over the content file, and a---right after a line reads as a setext heading underline in markdown. Prettier cheerfully rewrote every entry’s frontmatter into headings. Without noticing, I would have shipped an empty changelog. The file now lives in.prettierignore.
Envpilot problem two: functions answering questions nothing asked
Three smaller burns, all fixed in the same PR #183:
/api/version had no cache header. The CLI calls it on every command, the web dashboard polled it every five minutes per tab, and every response ran a function to return a frozen object. A version string changes when I deploy, which is a few times a week. It was being computed on every CLI invocation and every open tab.
The fix has three layers. The route now serves s-maxage=300 so repeat polls hit the CDN and the function never runs. The dashboard banner polls every 30 minutes instead of 5, and skips the fetch entirely when document.visibilityState says the tab is hidden, which kills the open-tab-overnight case. Worst case lag for a CLI learning about a new version: about 65 minutes, which is fine for “please update” and can be forced tighter by purging the cache in a real emergency.
/api/status existed to draw a colored dot. It POSTed to the UptimeRobot API, counted down monitors, and returned one word. 288 ISR writes a day plus an UptimeRobot call every five minutes, forever, so a footer dot could have a color. While auditing it I found something dumber: the blog and docs apps had a hardcoded default pointing at www.envpilot.dev/api/status, so both production apps were cross-origin fetching that route on every page load and failing. Route, component, prop threading, all deleted. The footer links to the hosted status page now, which is what users wanted anyway.
The middleware matched pages that need no session. The matcher excluded _next and file extensions, so /pricing, /faq, /privacy, /terms, /support, /contact and the comparison pages all booted the WorkOS AuthKit SDK, parsed cookies, and checked a session, only to be waved through by an allowlist one line later. Crawlers hitting those pages paid full middleware CPU to see a marketing page. I grepped every route for server-side withAuth() first, then excluded the safe ones from the matcher. /, /sign-in and /sign-up stay covered because they genuinely call withAuth() server-side.
Estimated result of the whole PR: ISR writes from 117,295 per month down to roughly 1,500. Under 1% of the cap.
Envpilot problem three: the dashboard waited for four queries before painting anything
This one isn’t a cost problem. It’s the reason the app felt slow, and fixing it cut rendering time more than anything else in this whole effort.
Every dashboard route on envpilot shared one layout that awaited the session, synced the Convex user, and ran three more queries before rendering a single element. Click a link and you saw nothing. The browser had the HTML shell sitting there doing nothing while the server serially resolved four round trips. On a good connection that’s a few hundred milliseconds of blank sidebar. On hotel wifi it feels broken.
The fix, PR #186. Upgrade to Next.js 16.3, turn on Cache Components and Partial Prefetching. The dashboard layout no longer awaits auth. loadDashboardAuth() returns a promise as seed data that a client provider consumes, so the shell (sidebar, nav chrome, skeletons) prerenders statically and streams the rest. The sidebar paints instantly on navigation; the data streams in behind it. Auth failures travel as data instead of exploding mid-render.
Public pages went static with use cache: pricing, changelog, sitemaps, the docs text routes like llms.txt and feed.xml. The build route table now shows dashboard routes as ◐ (Partial Prerender) and marketing routes as ○ (Static).
The part of this PR I’m proudest of is the test. instant-navigation.spec.ts uses @next/playwright’s instant() helper to pin the shell shape. If anyone slips a stray await cookies() into the layout again, or a usePathname() escapes its Suspense boundary, the build fails instead of thirty routes silently going dynamic. Performance regressions you can’t see will always ship; this one fails loudly.
Envpilot problem four: the API hop
Here’s the structural one, and it’s the change I’d defend hardest.
The dashboard originally talked to its own backend through Next.js API routes. Browser calls fetch("/api/variables"), the route handler authenticates, calls Convex, waits, re-wraps the result as JSON, and ships it back. That’s the standard API structure most Next.js apps ship with, and for envpilot it was wrong in three ways:
- Every read paid an extra HTTP hop and a function invocation. The browser was one WebSocket away from the database, and instead it made a round trip through a serverless function that billed me CPU to relay the answer.
- It lost reactivity. A
fetchgets you one answer. Change a variable in one tab and the other tab doesn’t know. Convex subscriptions get you a live query that updates itself. - Error handling flattened. Rich errors became JSON status codes, so “you hit your tier limit” arrived as a generic 500.
PR #173 started the cleanup for organizations, projects, and tags. Custom hooks like useProjectBySlug, useOrganizationMembers, useCreateProject replaced the fetch-and-parse pages, and the browser talks to Convex directly over its WebSocket. The server derives the actor from the session instead of trusting client-sent createdBy fields, which is also a security upgrade.
PR #182 finished it for everything else: variables, accounts, templates, preferences, project import/export, member management, doc-share revocation. The browser-only route handlers are deleted, roughly 3.9k lines out. Pages use useQuery/useMutation/useAction against Convex. Errors travel as ConvexError and get unwrapped by sanitizeConvexError, so tier-limit and duplicate-key messages survive production redaction instead of arriving as “Server Error”.
The detail that makes me trust this refactor long-term: an ESLint rule in apps/web/eslint.config.mjs that rejects fetch("/api/...") outside an allowlist. The allowlist is short and each entry documents why it earns the exception, things like the httpOnly AuthKit cookie, OAuth legs, Polar redirects, and the scrypt KDF for doc shares. Routes that genuinely need a server keep existing. Routes that were just relaying are gone, and lint keeps them gone.
One more win from PR #182 worth naming: vault import and export used to fan out unbounded requests at WorkOS Vault. Now they run through a bounded concurrency pool with explicit batch limits, and variable writes commit in a single transaction. Creating a project from a template returns as soon as the project row exists and streams provisioning progress to the page in the background. Same features, no thundering herd.
PagePilot: four invocations’ worth of work for an immutable blob
PagePilot hosts AI-generated plan pages. You get a URL like /p/a1b2c3, the content is immutable, and the URL itself is the capability. Given that description, guess how many times a single view should touch an origin server.
The answer is once, briefly. The actual answer was four separate pieces of billable work, and I traced each one before writing the fix.
Clerk middleware matched everything. The matcher excluded _next and file extensions, and a 12-character hex id has neither. I verified the matcher’s behavior directly: it ran on /p/* (deliberately unauthenticated, the URL is the auth), on /api/mcp (authenticates with a bearer key, never touches Clerk), and on / and /docs (fully static pages). A matched middleware route can never be a pure CDN hit, so Clerk’s cookie parsing and JWT verification were billed on every page view of a product that has no login-gated pages outside the dashboard.
<Show> made every route dynamic. This one I found during the build, not the analysis, and it’s the reason “just scope the middleware” would have broken the site. Clerk’s <Show> component is a server component that awaits auth(), and it sat in the root layout. One awaited call in the root layout makes every route in the entire app dynamic, because Next.js can’t prerender a tree whose root might depend on the request. Scoping the middleware alone would have left / and /docs calling auth() on routes where the middleware no longer ran. Swapping it for a client-side nav component is what actually flipped the landing page and docs to ○ Static.
/p/<id> was uncacheable and buffered. cache-control: no-store meant every refresh, every re-open, and every Slack/Discord unfurl replayed the full origin round trip. And the route read up to 900 KB of HTML into a JS string with transformToString(), then re-encoded it into a new response. A UTF-8 decode plus two full copies of billable CPU per view, for content that never changes. Under Fluid, that’s active CPU. Under streaming, it would be I/O wait, which bills differently.
The AWS SDK cost megabytes on cold start. @aws-sdk/client-s3 is 25 packages of module init on every cold start, to make six one-shot requests. Because the package was in serverExternalPackages, Node required it from node_modules on every cold boot and billed the module init. Replaced with aws4fetch, which is about 2 KB, because R2 speaks plain SigV4 and I don’t need an SDK to sign a request.
The fix, PR #3, landed all of it:
| Before | After | |
|---|---|---|
/ and /docs | ƒ dynamic, function per hit | ○ static, pure CDN |
/p/<id> | origin per view, 900 KB buffered | 60s edge cache, body streamed |
| Middleware | /, /docs, /p/*, /api/mcp | auth routes only |
| R2 client | @aws-sdk/client-s3 (25 pkgs) | aws4fetch (~2 KB) |
The edge cache uses Vercel-CDN-Cache-Control: public, s-maxage=60, stale-while-revalidate=86400. That header is stripped before the browser sees it, so clients still revalidate while Vercel’s edge absorbs the repeats. Origin now sees roughly one hit per page per minute instead of one per view.
One honest trade: deletes are no longer instant. The object leaves R2 immediately, but the edge can serve a copy for up to 60 seconds. That contradicted four places in my docs copy, including the delete_page tool description, so I corrected all of them rather than pretend. Security claims have to match reality. If a minute ever feels too long, CACHE_SECONDS in the route trades directly against origin hits.
What the dashboards show now
These screenshots are from August 22, four days after the last PR merged. Vercel’s meters are 30-day rolling windows, so they lag. But the shape of the fix is already visible at the right edge of every chart.
The writes chart is the cleanest signal:
Flat around 3,500 to 5,500 write units a day since July, then a cliff after August 17. Daily writes dropped to double digits. That’s PR #183. The changelog stopped regenerating itself, and the projection for the next full window is somewhere under 1% of the 200k cap.
Function invocations sit at 659,243 of a million, but here’s the part that looks wrong and isn’t:
Edge requests jumped in the last week, 853,619 and counting. That’s not new load. Cached responses count as edge requests, and they’re the cheap kind: served from CDN, zero functions, zero fluid CPU. PR #3 and PR #186 moved traffic that used to invoke a function onto the edge. The same request moved from the meter that has a 4-hour CPU cap to the meter that has a 100 GB allowance, and I’m using 27 GB of that. PagePilot alone accounts for 419,899 of those edge requests, and most of them never touched a function.
Functions storage tells its own little story: deployments peaked near 4 GB in late July and declined steadily to under 1 GB. Part of that is Vercel pruning old builds, part is the AWS SDK swap and the deleted API routes leaving PagePilot and envpilot.
Fluid Active CPU still reads 5h 28m, over the cap. Don’t panic at that number. The window includes the entire bad month. The daily bars tell the real story: 10 to 30 minutes a day before the fixes, 5 to 7 minutes a day after, and the recent bars are mostly legitimate work (dashboard SSR, REST API, MCP calls, Polar webhooks). Traffic I actually want to pay for.
Free tier math, honestly
Here’s the part I’d tell any friend in the same spot. The optimizations are worth doing regardless of tier, because waste is waste. A changelog regenerating 1,440 times a day against a database that changes four times a month is dumb at any price. An API route relaying a WebSocket-adjacent database call is dumb at any price.
But be honest about ceilings. The Hobby plan gives 4 hours of fluid CPU across every project on the account. After these fixes my steady-state burn is maybe 3 to 4 hours a month across ten projects. One good Show HN front page blows through that before lunch, and Vercel doesn’t degrade gracefully when you hit the cap. Sites start failing.
So my actual plan is both: ship the optimizations first, because $20 buys 20 hours of fluid CPU and I’d rather that 20 hours be spent on real traffic than on a changelog regenerating itself into the void. Upgrade before the launch, not during. Paying $20 a month to defend a free cap for a quarter is worse math than either alternative.
The general lesson
Every one of these burns followed the same pattern: code that pays for work on every request when the answer almost never changes. A changelog that changes monthly, regenerated minutely. An immutable blob, refetched per view. A version string, polled per command. An auth check, run on pages with no session. A database one WebSocket away, reached through a function that billed for the relay.
Serverless pricing is brutally honest about this pattern. The fix is always some version of the same move: figure out how often the answer actually changes, and push the work to that cadence. Build time instead of request time. CDN instead of origin. Push instead of poll. Direct connection instead of relay.
Your users get faster pages as a side effect. The dashboard gauges go green. And the invoice stays at zero.
Until next time, go break something.
References
- PagePilot PR #3: cut Vercel function usage on every hot path
- envpilot.dev PR #183: cut Vercel fluid compute on the public surface
- envpilot.dev PR #186: adopt Next.js 16.3 Cache Components
- envpilot.dev PR #182: move the dashboard onto Convex and pool the vault calls
- envpilot.dev PR #173: consolidate backend, replace API routes with Convex hooks
- Vercel Fluid Compute documentation
- Vercel: Vercel-CDN-Cache-Control header
- Next.js Cache Components
- Convex: queries and mutations
- aws4fetch
- Envpilot
- PagePilot
Discussion
Share your thoughts and engage with the community